Radial Wheel Progress Infographic Set Explained
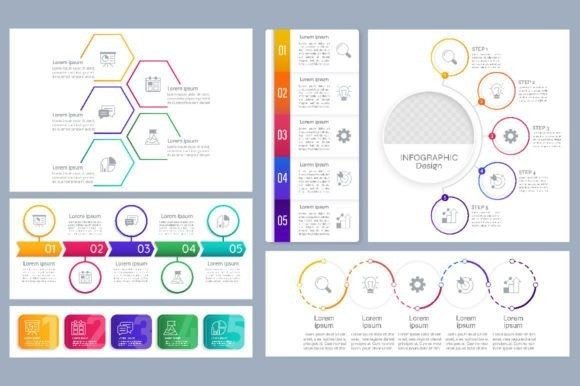
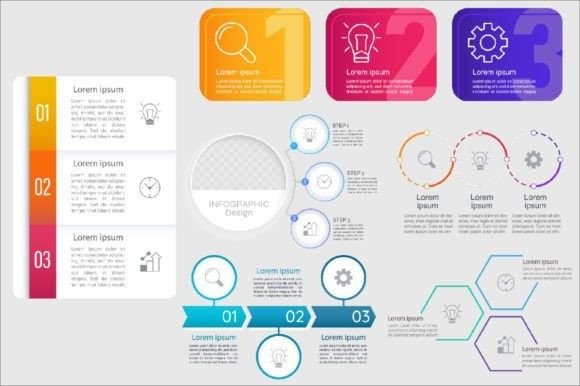
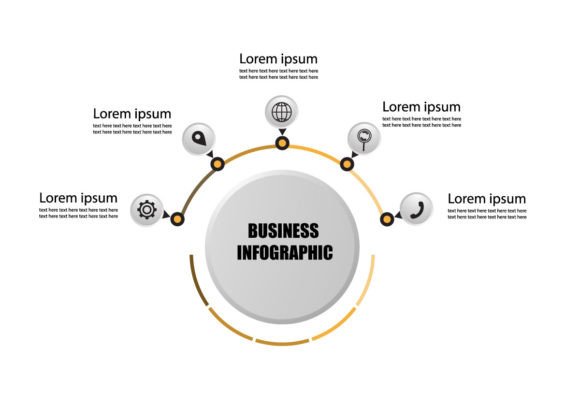
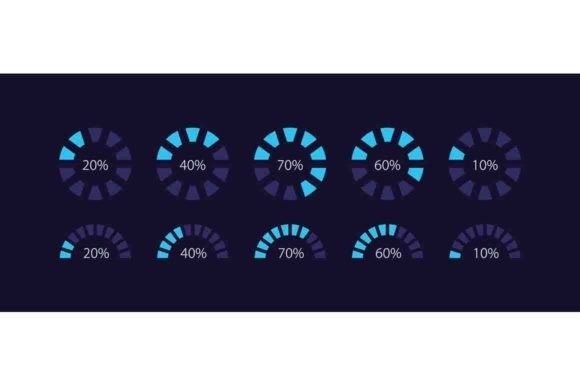
In a world saturated with information, presenting data clearly and compellingly is no longer a luxury but a necessity. Whether you’re preparing a business report, designing a marketing presentation, or creating educational materials, the challenge of making complex figures or progress metrics understandable can consume valuable time. This is where a specialized tool like the Radial Wheel Progress Infographic Set becomes an asset. It is a collection of ten distinct, editable circular diagrams designed specifically for visual data presentation, focusing on radial charts and progress loading circles.
The Core Advantage: Clarity Through Circular Design
Circular diagrams, like the wheels and loading circles in this set, offer a unique visual shorthand. Their radial nature intuitively suggests cycles, completion percentages, and interconnected parts. A radial wheel can instantly communicate project milestones, skill proficiency levels, or the breakdown of a budget in a way that a simple bar chart might not. The human eye is drawn to symmetry and completion, making these graphics exceptionally effective for capturing attention and aiding memory retention.
Consider a project manager needing to present quarterly progress to stakeholders. A static list of completed tasks is forgettable. Instead, using a customizable radial wheel from this set, where each segment fills as a milestone is achieved, creates a dynamic, at-a-glance snapshot of success. It transforms raw data into a visual story. This is the practical benefit: the set provides the structured visual framework, freeing you from the laborious design process so you can focus on the message itself.
Tailored for Professional and Creative Workflows
The utility of the Radial Wheel Progress Infographic Set extends across numerous roles. Marketers can use the loading circle variants to depict campaign rollout phases or audience growth. Educators and trainers might employ the wheels to illustrate curriculum modules or learning progress. Freelancers and small business owners can integrate these charts into client proposals or performance reports to add a layer of polished professionalism without needing extensive graphic design skills.
A key feature that supports this broad applicability is the set’s editability. The diagrams are provided as vector files (EPS, AI) and scalable formats (SVG, PNG). Using software like Adobe Illustrator, you can easily change colors—a crucial aspect given the included dark theme variant—adjust percentages, modify text labels, and resize elements without loss of quality. The use of clean, modern fonts like Myriad Pro-Bold and Regular ensures textual elements remain sharp and legible when integrated into your own layouts.
Solving Specific Presentation Challenges
Two common problems in visual communication are time constraints and theme consistency. This infographic set addresses both. For someone working against a deadline, having a pre-designed, professional collection of ten charts means not starting from a blank canvas. You select the wheel that best fits your data, customize it, and implement it. This efficiency directly translates to saved hours.
Furthermore, the inclusion of files on both white and transparent backgrounds (like PNG and SVG) and a dedicated dark theme set solves integration challenges. Whether your report uses a light corporate template or a sleek dark-mode website, you have assets that blend seamlessly. This attention to practical file formats—from JPEG for quick placement to AI for deep customization—means the set adapts to your workflow, not the other way around.
Beyond the Charts: A Resource for Continuous Creation
While the ten radial and progress charts are the core product, viewing this set as part of a broader creative ecosystem is important. The providers note ongoing creation of vector brochures, infographic templates, and customizable elements, with new graphics weekly. This suggests that acquiring the Radial Wheel Progress Infographic Set could be a step into a resource pool that evolves. For a blogger, marketer, or publisher who regularly needs fresh visual content, this potential for ongoing support is a significant consideration. Subscribing for updates becomes a strategy to maintain a contemporary and diverse visual toolkit.
However, it’s wise to assess fit. This set is inherently graphic. Its value is maximized when used within design-aware documents, presentations, websites, or publications. If your primary output is purely text-based with no visual component, its utility diminishes. Also, while highly customizable, it requires access to or familiarity with software that can handle vector files (like Illustrator or compatible free alternatives) to unlock its full potential. For those comfortable with such tools, it’s a powerful accelerant; for absolute beginners, there might be a short learning curve.
Strategic Applications in Decision-Making and Communication
Let’s explore a more nuanced application: simplifying complex decisions. A business owner evaluating multiple investment options could use a radial wheel to visually weight factors like risk, return, and time horizon. Each option gets a wheel where segments represent these criteria, filled proportionally. Comparing these visual wheels can make disparities and balances clearer than a spreadsheet, aiding intuitive decision-making.
Similarly, in strengthening internal communication, a team leader could use a progress loading circle in regular updates to show how close a critical initiative is to “full.” This creates a shared, motivational visual goal. The Radial Wheel Progress Infographic Set, therefore, moves beyond mere decoration. It becomes a tool for problem-solving and goal support by structuring information in a cognitively friendly format.
Who Benefits Most from This Infographic Collection?
The audience that will find the most immediate value are professionals, creators, and communicators who already operate in visual mediums but seek to elevate their work’s efficiency and impact. This includes:
- Entrepreneurs and Small Business Owners: Crafting investor pitches, annual reviews, and strategic plans that need to convey progress and structure convincingly.
- Marketers and Content Creators: Developing social media visuals, blog post graphics, or email campaign materials that require quick, engaging data snapshots.
- Educators and Trainers: Designing course materials, learning modules, or student progress reports that benefit from clear, motivating progress indicators.
- Freelancers (Designers, Consultants, Writers): Enhancing client deliverables with professional, customized visuals that strengthen reports and proposals.
For these groups, the Radial Wheel Progress Infographic Set acts as a bridge between having raw data and possessing a compelling visual narrative. It mitigates the design overhead while providing the aesthetic and functional components necessary for modern communication.
In conclusion, the value of this specific collection lies in its focused design, practical file formats, and thoughtful variations like the dark theme. It is a tool for those who understand that how information is presented profoundly affects how it is received and acted upon. By offering editable, professional circular diagrams, it empowers users to save time, enhance clarity, and ultimately, communicate more effectively in their professional and creative pursuits.